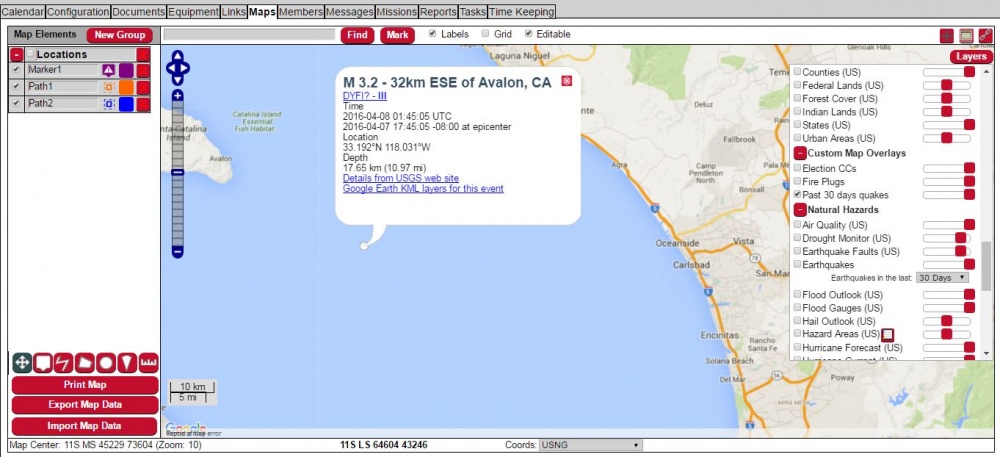
Map Layers
Mission Manager supports many map layers. These map layers can be overlaid and combined to produce very custom maps.
Base Maps
The following are some of the Base Map Layers that are supported:
| Name | Description | Sample |
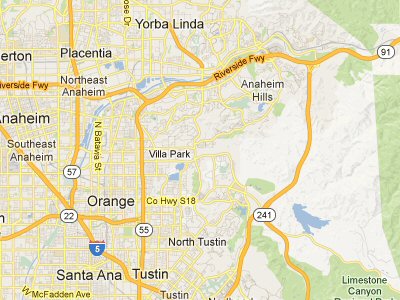
| Google Streets | Google Street map layer shows streets, water features, landmarks, etc.
Google Maps - Terms of Use Privacy |
|
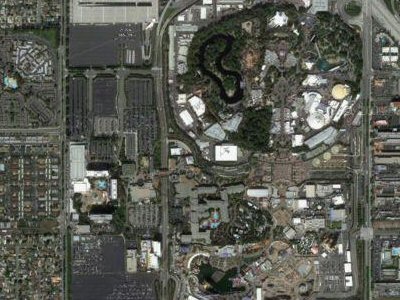
| Google Satellite | Google Satellite map layer shows actual satellite photos worldwide. At close zooms maps automatically change to aerial photos with higher detail.
Google Maps - Terms of Use Privacy |
|
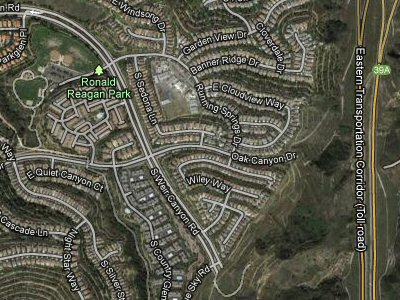
| Google Hybrid | Google Hybrid map layer shows a combination of Google Satellite and Street maps.
Google Maps - Terms of Use Privacy |
|
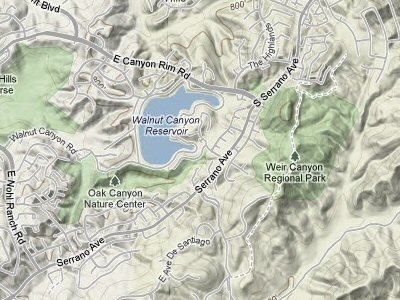
| Google Physical | Google Physical maps shows topographical map information, streets, landmark and includes hill shading.
Google Maps - Terms of Use Privacy |
|
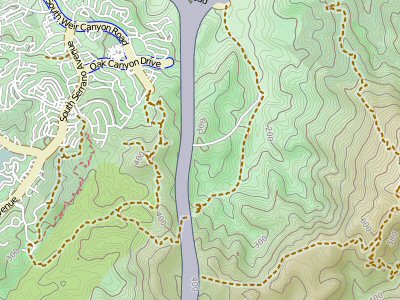
| Open Cycle Map | Open Cycle Map shows detailed information about terrain, trails and backcountry paths. This map type is available worldwide.
Data CC-by-SA by Open Cycle Map |
|
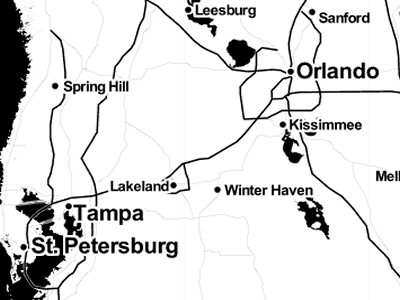
| Black and White | A simple black and white representation of the map base layer. This can be useful when overlaying other layers on top of the map, while wanting to keep the base layer very simple.
Data by: Stamen Design Studio |
|
Overlay Maps
The following are some of the Overlay Maps that are supported:
| Map Elements | Mission Manager allows you to create and edit lines, polygons, circles, markers, and pie shaped map elements. These elements are viable to anyone online and logged into the mission you are working on. | 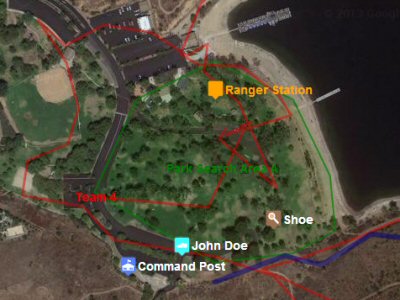
|
| USGS Topo | High resolution United States Geological Survey (USGS) topographical maps are available on this layer. | 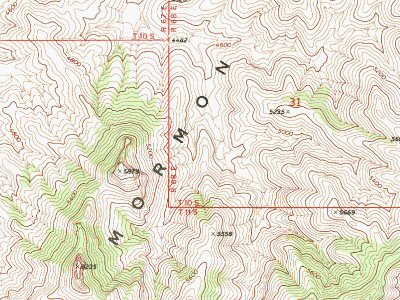
|
| USFS Topo | High resolution United States Forest Survey (USFS) topographical maps are available on this layer. These maps are only available for USFS lands. | 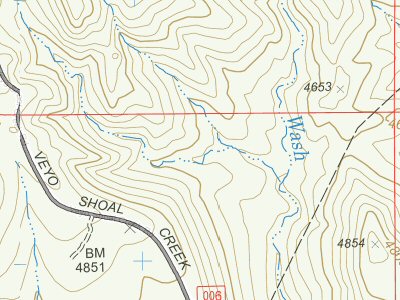
|
| Visitor Maps USFS | Sometimes the best maps for a particular location are the visitor maps created for park or location visitors. This map layer has United States Forest Service (USFS) maps. | 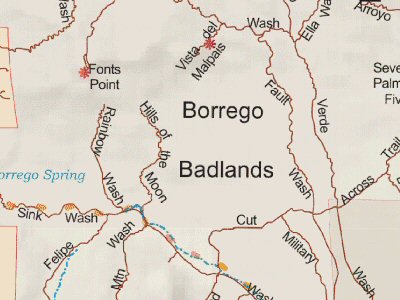
|
| Visitor Maps NPS | Sometimes the best maps for a particular location are the visitor maps created for park or location visitors. This map layer has National Park Visitor (NPS) maps. | 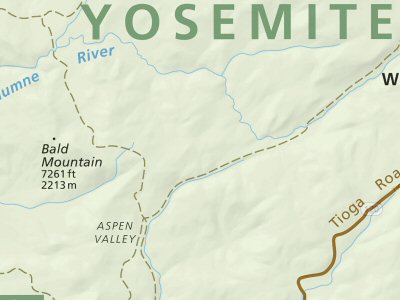
|
| Visitor Maps | Sometimes the best maps for a particular location are the visitor maps created for park or location visitors. This map layer has extensive park and visitor maps for particular areas.
Visitor Maps Courtesy of CalTopo and various US Government sources |

|
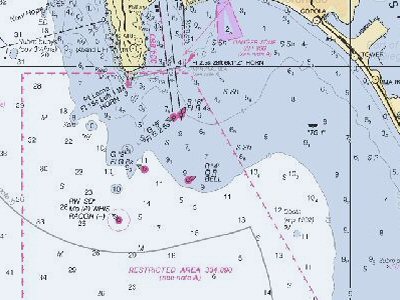
| Nautical Charts | Overlays National Oceanic and Atmospheric Administration (NOAA) Nautical Charts layer on top of the selected base layer.
This layer courtesy of NOAA. |
|
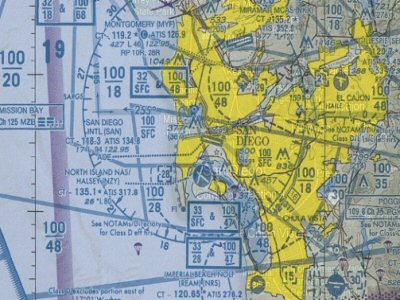
| Aviation - Sectional | Sectional Aviation maps used by pilots. This layer should not be used for actual navigation.
This layer courtesy of chartbundle.com and the FAA. |
|
| Aviation - World | World Aviation maps used by pilots. This layer should not be used for actual navigation.
This layer courtesy of chartbundle.com and the FAA. |

|
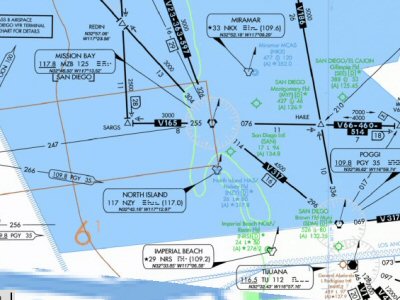
| Aviation - IFR Low | IFR Low Aviation maps used by pilots. This layer should not be used for actual navigation.
This layer courtesy of chartbundle.com and the FAA. |
|
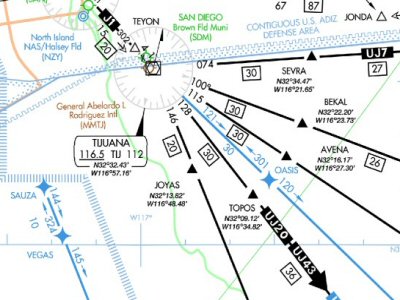
| Aviation - IFR High | IFR High Aviation maps used by pilots. This layer should not be used for actual navigation.
This layer courtesy of chartbundle.com and the FAA. |
|
| Map Features | Using Open Street Map, this layer provides street, river, stream and other feature information. This layer is very useful when overlaid over other layers. | 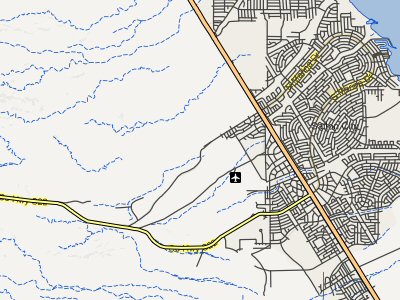
|
| Shading - Relief | This layer shows hill shading and is very useful when overlaid on topo maps. | 
|
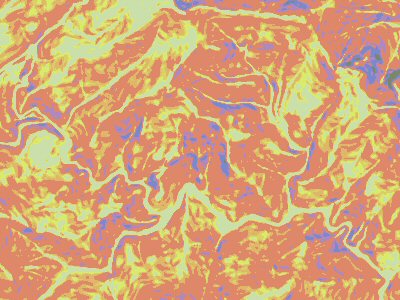
| Shading - Slope | This layer shows the steepness to the terrain based on color. The colors are (slope angle in degrees): 15 = green, 27 = yellow, 40 = red, 60 = blue. All intermediate slopes are an average of the two nearest fixed colors. In version 2, slopes less than 20 degrees are not shaded. 20-26 = green, 27-29 = yellow, 30-31 = light orange, 32-34 = dark orange, 35-45 = red, 46-50 = purple, 50+ = blue.
Shading - Slope Courtesy of CalTopo |
|
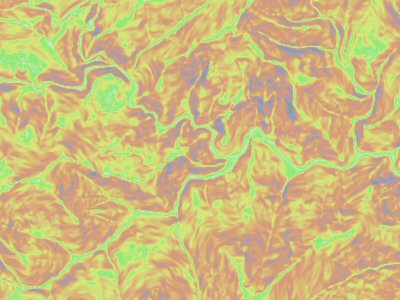
| Shading - Gradient | This layer shows the steepness to the terrain based on color. The colors are (slope angle in degrees): 15 = green, 27 = yellow, 40 = red, 60 = blue. All intermediate slopes are an average of the two nearest fixed colors. In version 2, slopes less than 20 degrees are not shaded. 20-26 = green, 27-29 = yellow, 30-31 = light orange, 32-34 = dark orange, 35-45 = red, 46-50 = purple, 50+ = blue.
Shading - Slope Courtesy of CalTopo |
|
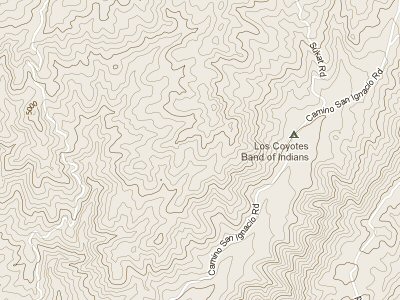
| Contour 10 Feet Lines | This layer shows the topo or contour lines based on 10' changes. This layer will automatically be disabled at very large or very large zoom levels.
Contour 10 Feet Lines Courtesy of TopOSM with data from OSM and USGS |
|
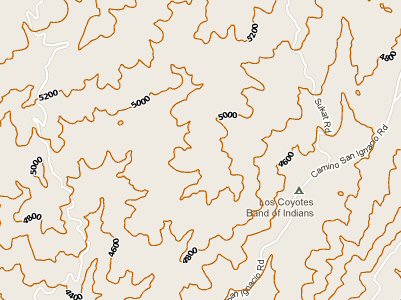
| Contour 40 Feet Lines | This layer shows the topo or contour lines based on 40' changes.
Shading - Slope Courtesy of CalTopo |
|
| Population Density | Worldwide population density can be displayed on the map. This can be very useful when dealing with an approaching weather event or other natural disaster. | 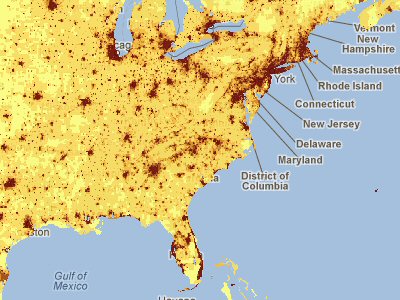
|
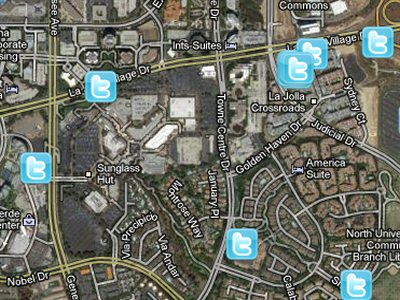
| The Twitter layer shows the location of geo located tweets in a certain area. This layer will only work at certain zoom levels. A set of strings separated by commas can be specified in the Layers dialog that will filter for tweets with those words only.
This layer can be used to show real time tweets related to an incident you may be working on. I.e. using the key words such as Flood, Missing Person, Fire, etc. |
| |
| Wikipedia | The Wikipedia layer will show those Wikipedia entries that are geocoded with a location. Clicking on one of the icons will open a popup with a link to the actual Wikipedia article.
Wikipedia Layer courtesy of Wikipedia. |

|
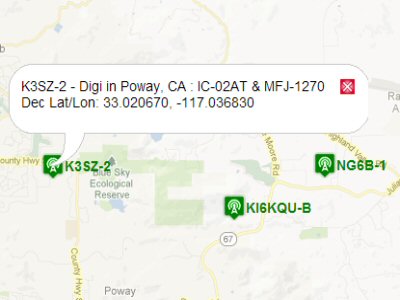
| APRS Tracking | In the Configuration screen, you can specify Ham Radio callsigns you would like to be tracked on your map. The locations of these APRS radio signals is shown on your map real time.
Clicking on the APRS icon will pop up a bubble showing more information about that item. APRS Tracking www.aprs.fi |
|
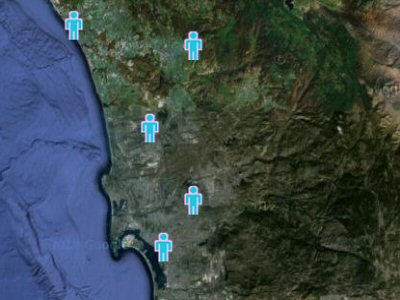
| Members (from addresses) | This layer shows the location of all your Active and non-Guest members based on their address entered on the Members screen.
Only members visible to the logged in member in the Members screen will be shown on the map. Note that the very first time you display this layer, if you have many members it may take a couple of minutes for the layer to display the addresses after conversion to map locations. Address lookups courtesy of [www.google.com Google] |
|
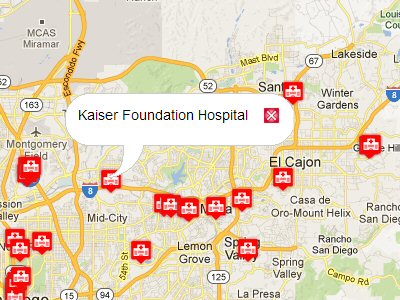
| Hospitals | At city level, zoomed maps can show the locations of Hospitals. Clicking on the icon will show more information about that Hospital.
POI (c) OpenStreetMap contributors, CC-BY-SA OSM Note: For Hospital, Police and Fire station locations. The OSM data source may be incomplete or incorrect, these are not recommended for mission critical situations. |
|
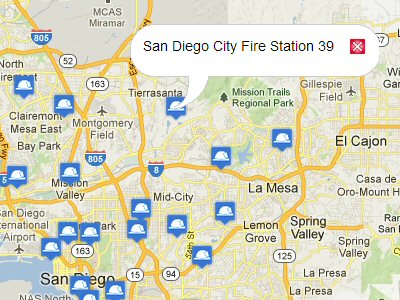
| Fire stations | At city level zooms maps can show the locations of Fire Stations. Clicking on the icon will show more information about that Fire Station.
POI (c) OpenStreetMap contributors, CC-BY-SA OSM Note: For Hospital, Police and Fire station locations. The OSM data source may be incomplete or incorrect, these are not recommended for mission critical situations. |
|
| Police stations | At city level zooms maps can show the locations of Police Stations. Clicking on the icon will show more information about that Police Station.
POI (c) OpenStreetMap contributors, CC-BY-SA OSM Note: For Hospital, Police and Fire station locations. The OSM data source may be incomplete or incorrect, these are not recommended for mission critical situations. |

|
| Gas Stations | Gas Stations - in the Points of interest section, shows gas station locations, including gas price and location when icon is clicked on | 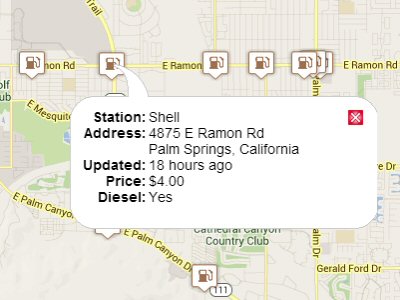
|
| Airports / Heliports | Air ports and Heliports. Click on the icon for more information. | 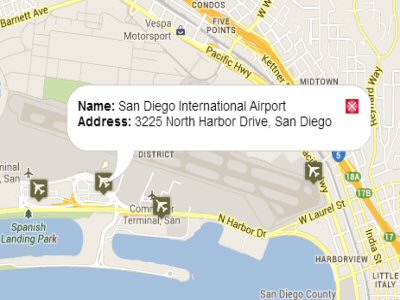
|
| Food | Locations for food and restaurants. Click on the icon for more information. | 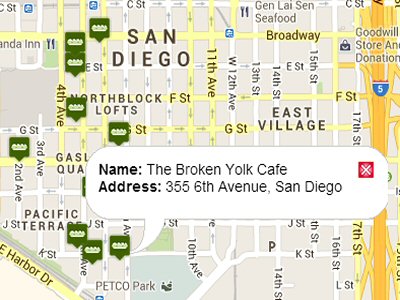
|
| Schools | Locations for schools. Click on the icon for more information. | 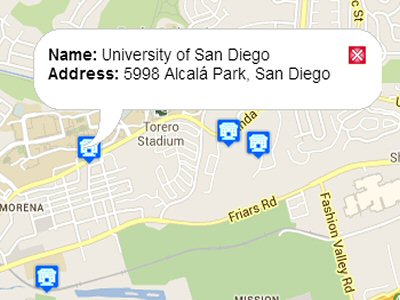
|
| Veterinary | Locations for Veterinary and Animal Care facilities. Click on the icon for more information. | 
|
| Cell Towers | The Import Areas button on the map screen will not only allow you to import GPX files that might come from a GPS device, but you can also upload cell phone location files, as provide from various cell phone providers. These file are usually supplied as a part of a warrant request. You must be logged in for this feature to work. | 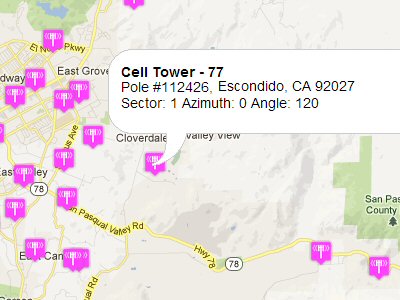
|
| Air Quality | This layer shows the current air quality reports from the EPA. Clicking on the icon will show more detailed information about the report and location. | 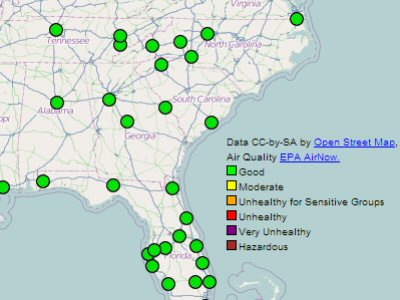
|
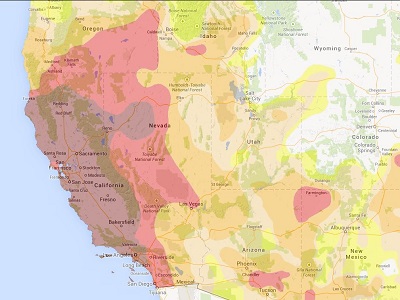
| Drought | Drought areas are shown with varying intensity represented by different colors
Drought data The National Drought Mitigation Center |
|
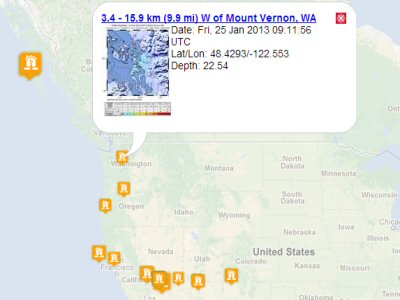
| Earthquakes | Earthquake data is available for around the world with the Earthquake layer. The size of the icon indicates the magnitude of the earthquake. Clicking on the icon will give you more information about the earthquake with links back to the USGS detailed information.
Earthquake data USGS |
|
| Flood Outlook | This layer shows the current flood outlook as predicted by NOAA-NCEP. | 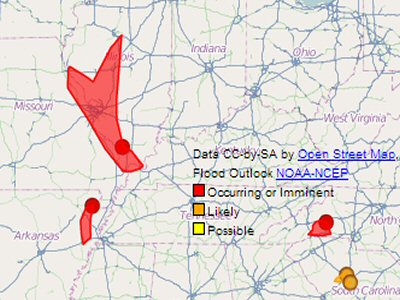
|
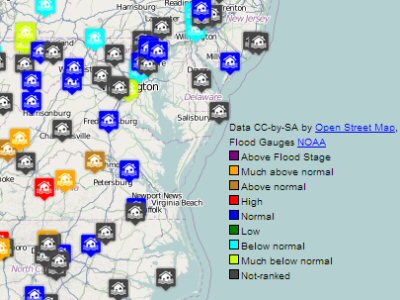
| Floods | Flood information can be shown for the US. Clicking on the icon will show detailed information about the flood.
Floods USGS |
|
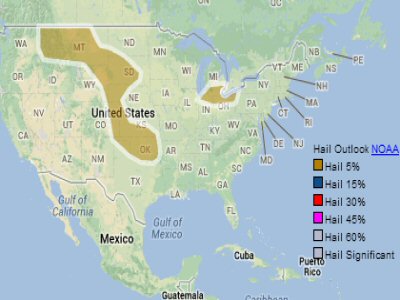
| Hail Outlook (US) | Shows the hazardous Hail outlook for the US.
Hail Outlook NOAA |
|
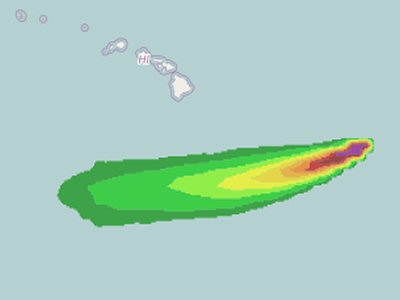
| Hurricane Wind | Predicted current hurricane wind strengths.
Hurricanes NOAA |
|
| Hurricane Forecast | Predicted current hurricane forecasted track.
Hurricanes NOAA |

|
| Hurricanes | Hurricane location can be shown with the hurricane layer. Clicking on the icon will show detailed information about the Hurricane.
Hurricanes NOAA |
|
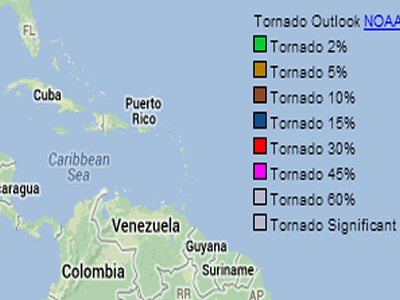
| Tornado Outlook (US) | Shows the hazardous Tornado outlook for the US.
Tsunami Warnings data NOAA |
|
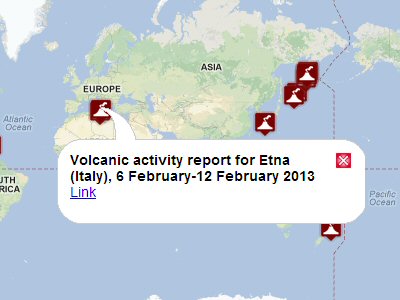
| Volcanoes | Volcano location and warning levels can be shown with the volcano layer. Clicking on the icon will show detailed information about the volcano.
Volcano USGS |
|
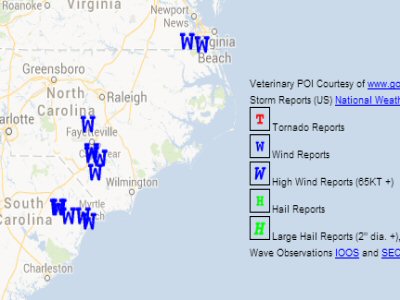
| Storm Reports (US) | Current Reported active Storm Reports for tornados, wind, and hail.
National Weather Service (NOAA-NWS) http://www.weather.gov/ |
|
| Wave Observations (US) | Wave Observation - in the Natural Hazards section that shows high wave height areas in the US, including the Great Lakes | 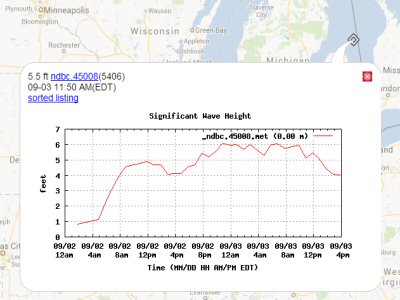
|
| Wildfire Perimeters (CA) | This layer shows the active and recent California wildfire locations as reported by CAL-FIRE. Some fires may have a perimeter showing the area of the fire. Clicking on the icon will show detailed information about the fire. | 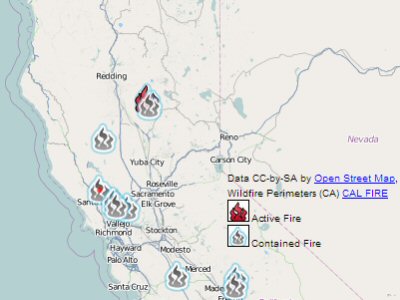
|
| Wildfire Perimeters (US) | This layer shows the active and recent California wildfire locations as reported by CAL-FIRE. Some fires may have a perimeter showing the area of the fire. Clicking on the icon will show detailed information about the fire. | 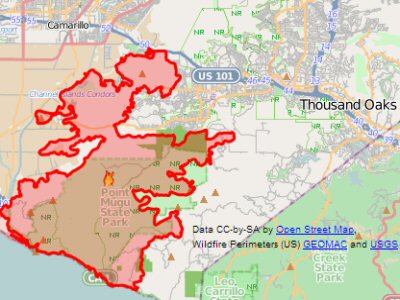
|
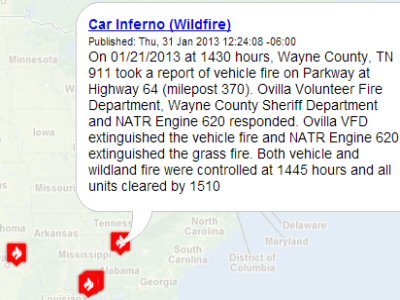
| Wildfires (InciWeb) | Wildfire location and warning levels can be shown with the wildfire layer. Clicking on the icon will show detailed information about the wildfire.
Wildfire InciWeb |
|
| Wildfires - MODIS | This layer are fire detections found by NASA's satellites using the MODIS program. | 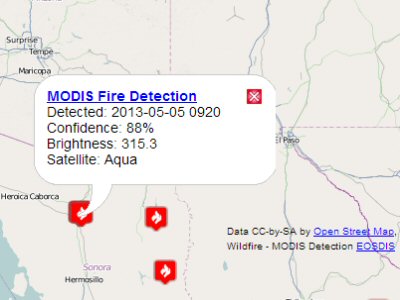
|
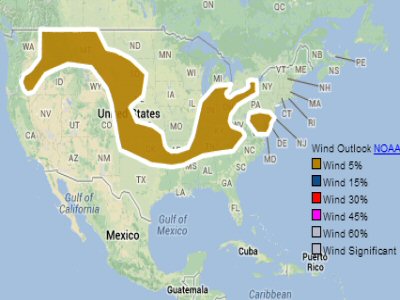
| Wind Outlook (US) | Shows the hazardous Wind outlook for the US.
Tsunami Warnings data NOAA |
|
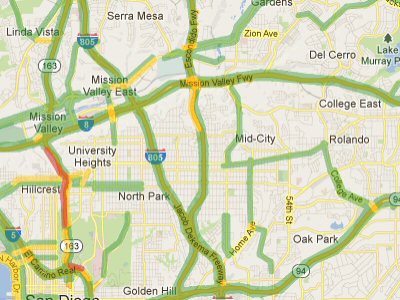
| Traffic Flow | Details about current traffic flow can seen for cities around the world. Green shows traffic moving normally, yellow indicates slowing traffic, and red means the traffic is stop and go. This layer is only available when zoomed into city level.
(c) Traffic Data Courtesy of |
|
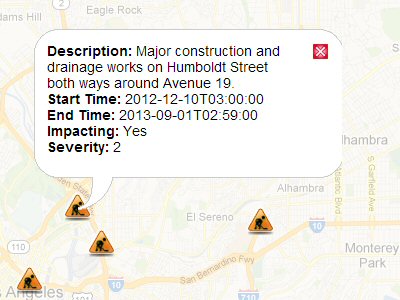
| Traffic Construction | Current traffic construction sites can be displayed on this layer. Clicking on one of these icons will show detailed information about the construction.
(c) Traffic Data Courtesy of |
|
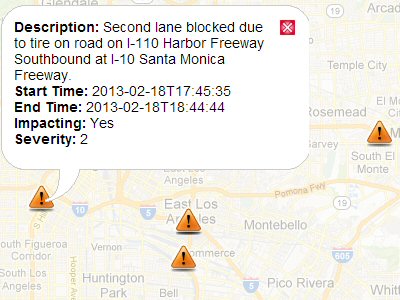
| Traffic Incidents | Current traffic incidents sites can be displayed on this layer. Clicking on one of these icons will show detailed information about the incident.
(c) Traffic Data Courtesy of |
|
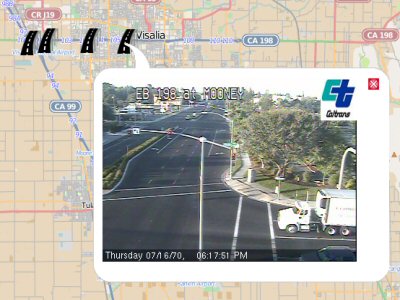
| Traffic Cameras | Live Traffic cameras are shown on this layer. Clicking on one of these icons will show the most recent photo from the traffic camera. The images will automatically refresh to show the latest image.
Traffic Cameras Courtesy of Caltrans |
|
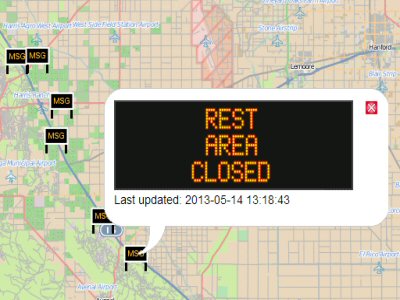
| Traffic Message Signs | Message boards for roads and freeways are shown on this layer. Clicking on one of these icons will show detailed information about the sign.
Traffic Cameras Courtesy of Caltrans |
|
| Weather Icons | Current weather for 25,000 cities in the world based on online data from weather stations. Not every location in the world has a weather station. Due to that fact, the weather for cities is calculated based on the measurement of the closest weather stations and global weather forecasts for the region. Data is also shown from professional and home weather stations. Clicking on a weather icon will show more details.
Weather - Icons data CC-by-SA by Open Weather Map |
|
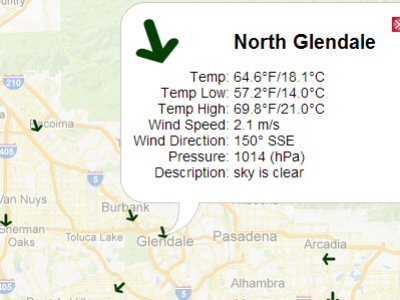
| Weather Wind Direction | Wind direction icons will show the direction of the wind as collected from that weather station.
Weather - Wind Direction data CC-by-SA by Open Weather Map |
|
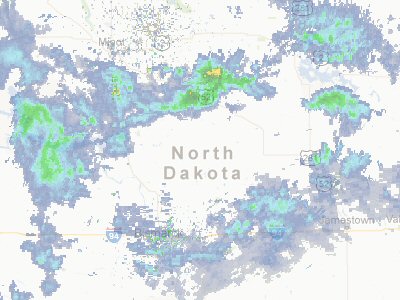
| Weather Radar | Current weather and storm radar layer.
Weather - Radar data courtesy of NEXRAD |
|
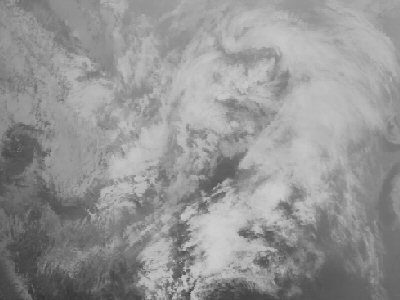
| Weather Clouds | Current satellite clouds layer.
Weather - cloud data courtesy of NEXRAD |
|
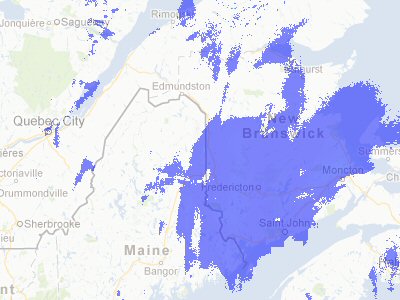
| Weather Precipitation | Current weather precipitation layer.
Weather - cloud data courtesy of NEXRAD |
|
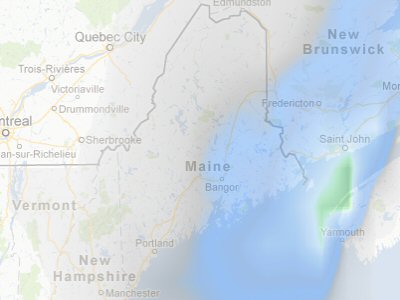
| Weather Snow | Shows the location of recent and current snow.
Weather - Snow data CC-by-SA by Open Weather Map |
|
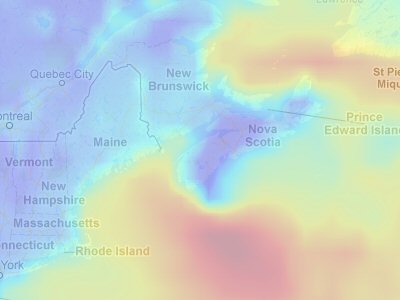
| Weather Wind | Shows current winds.
Weather - Wind data CC-by-SA by Open Weather Map |
|
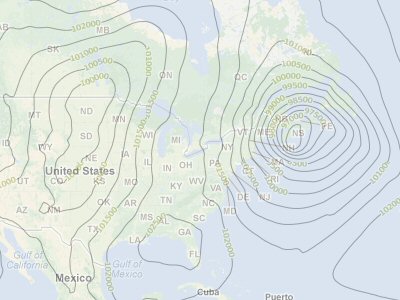
| Weather Pressure Contours | Shows worldwide barometric pressure contour lines.
Weather - Barometric pressure data CC-by-SA by Open Weather Map |
|
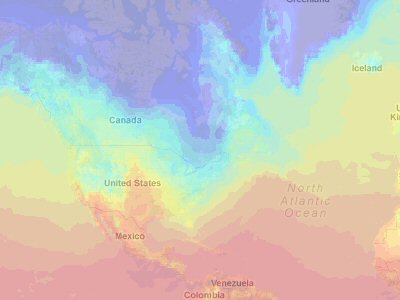
| Weather Temperature | Shows current weather temperature overlay.
Weather - Temperature data CC-by-SA by Open Weather Map |
|
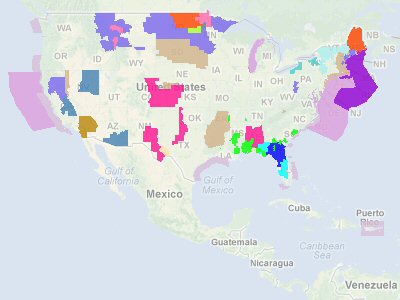
| Weather Hazard Areas | Shows current weather hazard areas. For a detailed description of the various colors see the Hazards Map Legend.
Weather Hazard Areas NOAA |
|
Custom Map Overlays
Mission Manager allows for custom user overlays. The setup is accomplished via the Configuration screen.
The preferred file type for the overlay is Google's KML/KMZ file. KML stands for Keyhole Markup Language and KMZ is a compressed version of that file. Both file types are based on the XML standard. You can learn more about KML files at Google's KML Tutorial.
It's important to make sure your KML files are properly formatted. Try one of the following KML validators: Feed Validator or KML Validator
NOTE!! Google imposes a maximum KML file size of 10 MB. If your KML file is larger than that, it will not load.
On Mission Manager's Configuration screen, in the Mapping Settings section, enter a title for your custom overlay. Next enter the URL link for the KML file. You can also set the Max Zoom and Transparency for the overlay. Using the dropdown box, choose KML as the file type. If you want Mission Manager to update the KML link when it loads, then check the box next to Update.
To use, click on the Layers button at the top right of the Map screen. Scroll down to Custom Map Overlays and choose the layer you want to enable.
NOTE: The URL link for the Custom Map Overlay must be hosted on a server that is publicly accessible, meaning no passwords to access. Here's a free method to host a file using Google Sites.
--Make sure you’re logged into Google.
--Go to sites.google.com/classic (I'm sure the new site would work, these instructions use the classic site).
--Click on CREATE button, and in the dropdown choose Classic Sites.
--Name your site in the field provided. It must be a name no one else has chosen, such as mm-example. I would not use spaces in the title.
--Click the “I’m not a robot” reCAPTCHA box and go through those hurdles if needed.
--Click the red CREATE button towards the top to proceed.
--On the newly created site, click the ‘create page’ icon in the upper right (looks like a page with '+' on top).
--Name the new page in the box provided. Again I would not use spaces. How about ‘files’?
--Below the naming area, select a template to use. Choose ‘File Cabinet’.
--For ‘Select a location’, I left it alone, which is ‘Put page at the top level’.
--Click the red CREATE button towards the top to proceed.
--On the resulting page, click on the ‘+ Add file’ icon and choose your kml file to upload. As before, I recommend naming the uploaded file so there are no spaces (example.kml).
--The URL you need to put in the Configuration section of Mission Manager, in the Mapping Settings area, is something like (depending on what you named things):

